In this notebook, an ODIM_H5 file is read using BALTRAD. Then the rain rate is determined from the calculated specific attenuation using Py-ART. This is a severe flooding case from July 8, 2013 in Toronto, Canada, with radar data from the King City, Ontario, radar.
retrieve data from s3 bucket
import os
import urllib.request
from pathlib import Path

# Set the URL for the cloud
URL = "https://js2.jetstream-cloud.org:8001/"
path = "pythia/radar/erad2024/baltrad/pyart2baltrad"
!mkdir -p data
files = ["WKR_201307082030.h5"]
for file in files:
    file0 = os.path.join(path, file)
    name = os.path.join("data", Path(file).name)
    if not os.path.exists(name):
        print(f"downloading, {name}")
        urllib.request.urlretrieve(f"{URL}{file0}", name)
downloading, data/WKR_201307082030.h5
%matplotlib inlineImport the necessary modules.
import numpy as np
import pyart
import baltrad_pyart_bridge as bridge  # routines to pass data from Py-ART and BALTRAD
import _raveio  # BALTRAD's input/output module
import cmweather
## You are using the Python ARM Radar Toolkit (Py-ART), an open source
## library for working with weather radar data. Py-ART is partly
## supported by the U.S. Department of Energy as part of the Atmospheric
## Radiation Measurement (ARM) Climate Research Facility, an Office of
## Science user facility.
##
## If you use this software to prepare a publication, please cite:
##
##     JJ Helmus and SM Collis, JORS 2016, doi: 10.5334/jors.119
Read in the data using RAVE (a component of BALTRAD)
Rain rate retrieval using specific attenuation using BALTRAD and Py-ART
rio = _raveio.open("data/WKR_201307082030.h5")Convert the data to a Py-ART Radar object.
radar = bridge.raveio2radar(rio)Examine some of the radar moments.
display = pyart.graph.RadarDisplay(radar)display.plot_ppi("DBZH", 0, vmin=-15, vmax=60)
display.plot_range_rings([50, 100, 150])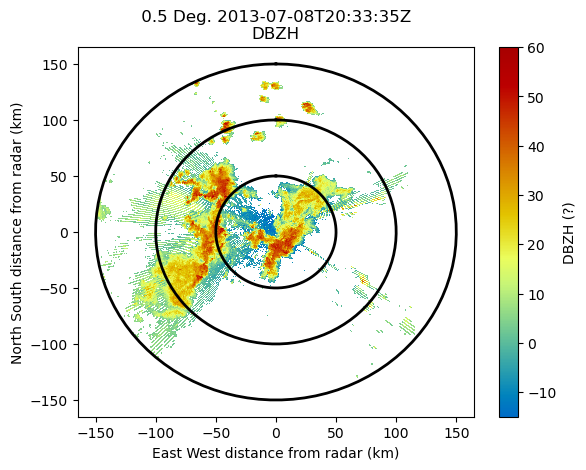
display.plot_ppi("PHIDP", 0, vmin=0, vmax=180, cmap="ChaseSpectral")
display.plot_range_rings([50, 100, 150])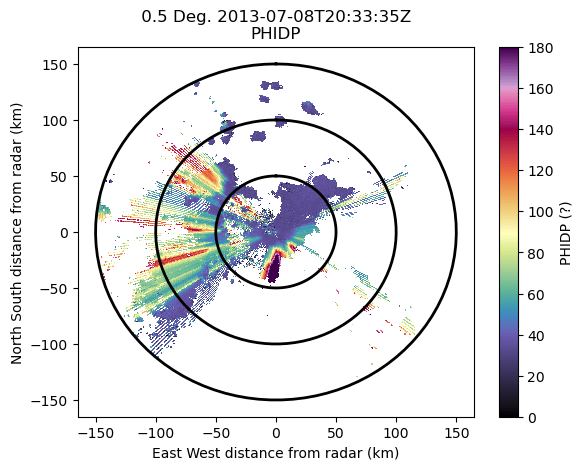
display.plot_ppi("RHOHV", 0, vmin=0, vmax=1.0, mask_outside=False, cmap="CM_rhohv")
display.plot_range_rings([50, 100, 150])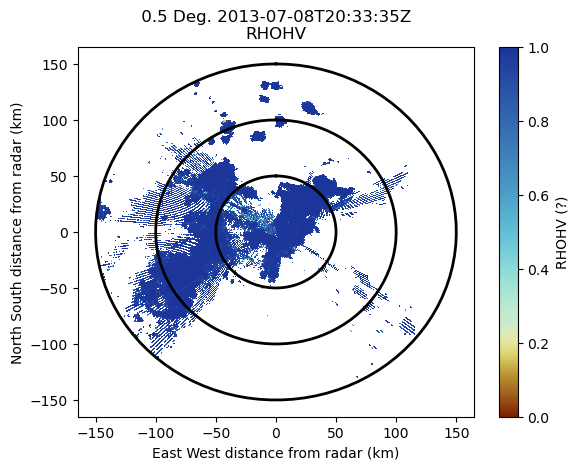
display.plot_ppi("SQIH", 0, vmin=0, vmax=1, mask_outside=False, cmap="ChaseSpectral")
display.plot_range_rings([50, 100, 150])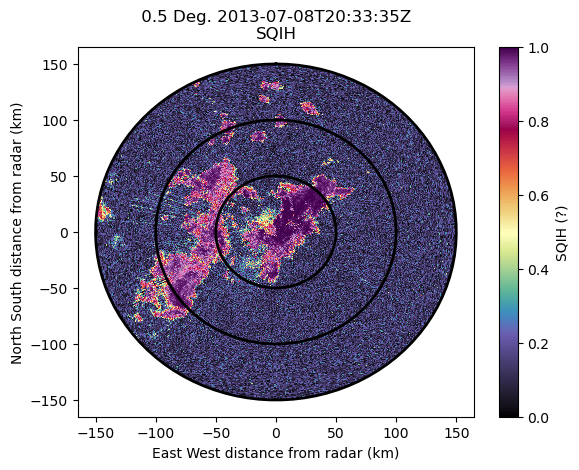
Calculate the specific attenuation and attenuation corrected reflectivity using Py-ART, add these field to the radar object.
radar.info()altitude:
data: <ndarray of type: float64 and shape: (1,)>
long_name: Altitude
standard_name: Altitude
units: meters
positive: up
altitude_agl: None
antenna_transition: None
azimuth:
data: <ndarray of type: float32 and shape: (720,)>
units: degrees
standard_name: beam_azimuth_angle
long_name: azimuth_angle_from_true_north
axis: radial_azimuth_coordinate
comment: Azimuth of antenna relative to true north
elevation:
data: <ndarray of type: float32 and shape: (720,)>
units: degrees
standard_name: beam_elevation_angle
long_name: elevation_angle_from_horizontal_plane
axis: radial_elevation_coordinate
comment: Elevation of antenna relative to the horizontal plane
fields:
DBZH:
data: <ndarray of type: float32 and shape: (720, 600)>
RHOHV:
data: <ndarray of type: float32 and shape: (720, 600)>
WRADH:
data: <ndarray of type: float32 and shape: (720, 600)>
PHIDP:
data: <ndarray of type: float32 and shape: (720, 600)>
ZDR:
data: <ndarray of type: float32 and shape: (720, 600)>
SQIH:
data: <ndarray of type: float32 and shape: (720, 600)>
VRADH:
data: <ndarray of type: float32 and shape: (720, 600)>
KDP:
data: <ndarray of type: float32 and shape: (720, 600)>
TH:
data: <ndarray of type: float32 and shape: (720, 600)>
fixed_angle:
data: <ndarray of type: float32 and shape: (1,)>
long_name: Target angle for sweep
units: degrees
standard_name: target_fixed_angle
instrument_parameters:
radar_beam_width_h:
data: <ndarray of type: float32 and shape: (1,)>
units: degrees
meta_group: radar_parameters
long_name: Antenna beam width H polarization
latitude:
data: <ndarray of type: float64 and shape: (1,)>
long_name: Latitude
standard_name: Latitude
units: degrees_north
longitude:
data: <ndarray of type: float64 and shape: (1,)>
long_name: Longitude
standard_name: Longitude
units: degrees_east
nsweeps: 1
ngates: 600
nrays: 720
radar_calibration: None
range:
data: <ndarray of type: float32 and shape: (600,)>
units: meters
standard_name: projection_range_coordinate
long_name: range_to_measurement_volume
axis: radial_range_coordinate
spacing_is_constant: true
comment: Coordinate variable for range. Range to center of each bin.
meters_to_center_of_first_gate: 0.0
meters_between_gates: 250.0
scan_rate: None
scan_type: ppi
sweep_end_ray_index:
data: <ndarray of type: int32 and shape: (1,)>
long_name: Index of last ray in sweep, 0-based
units: count
sweep_mode:
data: <ndarray of type: <U20 and shape: (1,)>
units: unitless
standard_name: sweep_mode
long_name: Sweep mode
comment: Options are: "sector", "coplane", "rhi", "vertical_pointing", "idle", "azimuth_surveillance", "elevation_surveillance", "sunscan", "pointing", "manual_ppi", "manual_rhi"
sweep_number:
data: <ndarray of type: int32 and shape: (1,)>
units: count
standard_name: sweep_number
long_name: Sweep number
sweep_start_ray_index:
data: <ndarray of type: int32 and shape: (1,)>
long_name: Index of first ray in sweep, 0-based
units: count
target_scan_rate: None
time:
data: <ndarray of type: float32 and shape: (720,)>
units: seconds since 2013-07-08T20:33:35Z
standard_name: time
long_name: time_in_seconds_since_volume_start
calendar: gregorian
comment: Coordinate variable for time. Time at the center of each ray, in fractional seconds since the global variable time_coverage_start
metadata:
Conventions: CF/Radial instrument_parameters
version: 1.3
title:
institution:
references:
source: NOD:cawkr,PLC:King ON
history:
comment:
instrument_name:
original_container: odim_h5
spec_at, cor_z = pyart.correct.calculate_attenuation(
    radar,
    0,
    doc=0,
    refl_field="DBZH",
    ncp_field="SQIH",
    rhv_field="RHOHV",
    phidp_field="PHIDP",
    fzl=8000,
)
# use the parameter below for a more 'cleanup up' attenuation field
# ncp_min=-1, rhv_min=-1)radar.info()altitude:
data: <ndarray of type: float64 and shape: (1,)>
long_name: Altitude
standard_name: Altitude
units: meters
positive: up
altitude_agl: None
antenna_transition: None
azimuth:
data: <ndarray of type: float32 and shape: (720,)>
units: degrees
standard_name: beam_azimuth_angle
long_name: azimuth_angle_from_true_north
axis: radial_azimuth_coordinate
comment: Azimuth of antenna relative to true north
elevation:
data: <ndarray of type: float32 and shape: (720,)>
units: degrees
standard_name: beam_elevation_angle
long_name: elevation_angle_from_horizontal_plane
axis: radial_elevation_coordinate
comment: Elevation of antenna relative to the horizontal plane
fields:
DBZH:
data: <ndarray of type: float32 and shape: (720, 600)>
RHOHV:
data: <ndarray of type: float32 and shape: (720, 600)>
WRADH:
data: <ndarray of type: float32 and shape: (720, 600)>
PHIDP:
data: <ndarray of type: float32 and shape: (720, 600)>
ZDR:
data: <ndarray of type: float32 and shape: (720, 600)>
SQIH:
data: <ndarray of type: float32 and shape: (720, 600)>
VRADH:
data: <ndarray of type: float32 and shape: (720, 600)>
KDP:
data: <ndarray of type: float32 and shape: (720, 600)>
TH:
data: <ndarray of type: float32 and shape: (720, 600)>
fixed_angle:
data: <ndarray of type: float32 and shape: (1,)>
long_name: Target angle for sweep
units: degrees
standard_name: target_fixed_angle
instrument_parameters:
radar_beam_width_h:
data: <ndarray of type: float32 and shape: (1,)>
units: degrees
meta_group: radar_parameters
long_name: Antenna beam width H polarization
latitude:
data: <ndarray of type: float64 and shape: (1,)>
long_name: Latitude
standard_name: Latitude
units: degrees_north
longitude:
data: <ndarray of type: float64 and shape: (1,)>
long_name: Longitude
standard_name: Longitude
units: degrees_east
nsweeps: 1
ngates: 600
nrays: 720
radar_calibration: None
range:
data: <ndarray of type: float32 and shape: (600,)>
units: meters
standard_name: projection_range_coordinate
long_name: range_to_measurement_volume
axis: radial_range_coordinate
spacing_is_constant: true
comment: Coordinate variable for range. Range to center of each bin.
meters_to_center_of_first_gate: 0.0
meters_between_gates: 250.0
scan_rate: None
scan_type: ppi
sweep_end_ray_index:
data: <ndarray of type: int32 and shape: (1,)>
long_name: Index of last ray in sweep, 0-based
units: count
sweep_mode:
data: <ndarray of type: <U20 and shape: (1,)>
units: unitless
standard_name: sweep_mode
long_name: Sweep mode
comment: Options are: "sector", "coplane", "rhi", "vertical_pointing", "idle", "azimuth_surveillance", "elevation_surveillance", "sunscan", "pointing", "manual_ppi", "manual_rhi"
sweep_number:
data: <ndarray of type: int32 and shape: (1,)>
units: count
standard_name: sweep_number
long_name: Sweep number
sweep_start_ray_index:
data: <ndarray of type: int32 and shape: (1,)>
long_name: Index of first ray in sweep, 0-based
units: count
target_scan_rate: None
time:
data: <ndarray of type: float32 and shape: (720,)>
units: seconds since 2013-07-08T20:33:35Z
standard_name: time
long_name: time_in_seconds_since_volume_start
calendar: gregorian
comment: Coordinate variable for time. Time at the center of each ray, in fractional seconds since the global variable time_coverage_start
metadata:
Conventions: CF/Radial instrument_parameters
version: 1.3
title:
institution:
references:
source: NOD:cawkr,PLC:King ON
history:
comment:
instrument_name:
original_container: odim_h5
radar.add_field("specific_attenuation", spec_at)
radar.add_field("corrected_reflectivity", cor_z)
Examine these two new fields.
display.plot_ppi("specific_attenuation", 0, vmin=0, vmax=0.1)
display.plot_range_rings([50, 100, 150])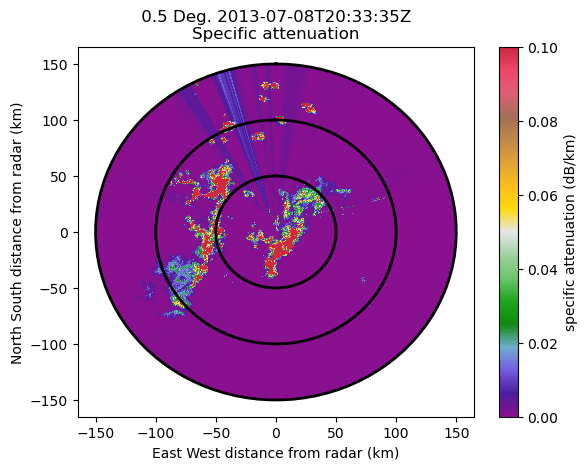
display.plot_ppi("corrected_reflectivity", 0, vmin=-15, vmax=60)
display.plot_range_rings([50, 100, 150])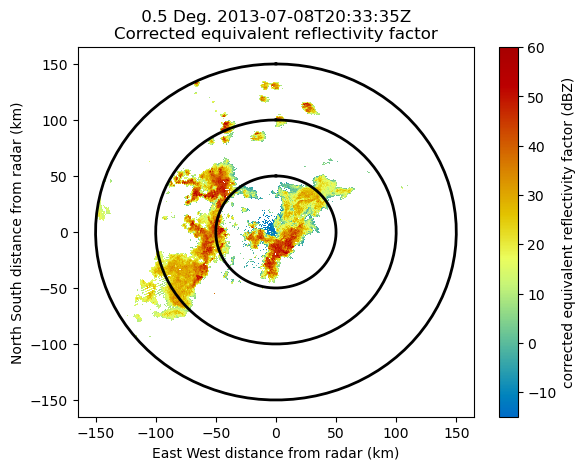
Calculate the rain rate from the specific attenuation using a power law determined from the ARM Southern Great Plains site. Mask values where the attenuation is not valid (when the cross correlation ratio or signal quality is low). Add this field to the radar object.
R = 300.0 * (radar.fields["specific_attenuation"]["data"]) ** 0.89
rain_rate_dic = pyart.config.get_metadata("rain_rate")
rain_rate_dic["units"] = "mm/hr"
rate_not_valid = np.logical_or(
    (radar.fields["SQIH"]["data"] < 0.4), (radar.fields["RHOHV"]["data"] < 0.8)
)
rain_rate_dic["data"] = np.ma.masked_where(rate_not_valid, R)
# fill the missing values with 0 for a nicer plot
rain_rate_dic["data"] = np.ma.filled(rain_rate_dic["data"], 0)
radar.add_field("RATE", rain_rate_dic)Examine the rain rate
display.plot_ppi("RATE", 0, vmin=0, vmax=50.0)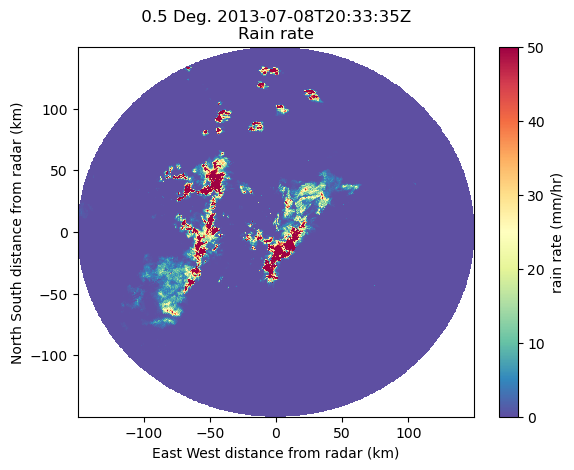
Create a new RaveIO object from the Py-ART radar object and write this out using Rave
rio_out = bridge.radar2raveio(radar)container = _raveio.new()
container.object = rio_out.object
container.save("data/WKR_201307082030_with_rain_rate.h5")
import os
print(
"ODIM_H5 file is %i bytes large"
% os.path.getsize("data/WKR_201307082030_with_rain_rate.h5")
)ODIM_H5 file is 6259795 bytes large