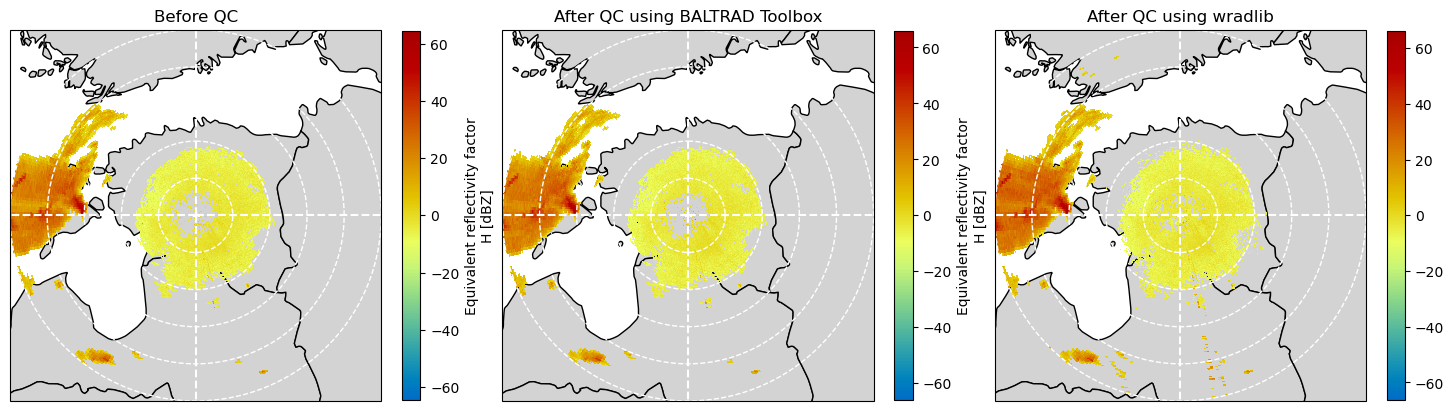
Comparison between BALTRAD and wradlib attenuation correction
Retrieve data from s3 bucket
import os
import urllib.request
from pathlib import Path

# Set the URL for the cloud
URL = "https://js2.jetstream-cloud.org:8001/"
path = "pythia/radar/erad2024/baltrad/baltrad2wradlib/"
!mkdir -p data
!mkdir -p shp
files = [
    "data/201405190715_SUR.h5",
    "shp/europe_countries.dbf",
    "shp/europe_countries.prj",
    "shp/europe_countries.sbn",
    "shp/europe_countries.sbx",
    "shp/europe_countries.shp",
    "shp/europe_countries.shx",
]
for file in files:
    file0 = os.path.join(path, Path(file).name)
    if not os.path.exists(file):
        print(f"downloading, {file}")
        x = urllib.request.urlretrieve(f"{URL}{file0}", file)
downloading, data/201405190715_SUR.h5
downloading, shp/europe_countries.dbf
downloading, shp/europe_countries.prj
downloading, shp/europe_countries.sbn
downloading, shp/europe_countries.sbx
downloading, shp/europe_countries.shp
downloading, shp/europe_countries.shx
Prepare your environment
%matplotlib inlineimport gc
import matplotlib.pyplot as plt
import matplotlib.ticker as mticker
import numpy as np
import shapefile
import wradlib
import xradar as xd
from matplotlib.collections import PatchCollection
from matplotlib.patches import PolygonRun BALTRAD’s odc_toolbox
First, you will process a scan from Suergavere (Estland) by using BALTRAD’s odc_toolbox.
From your VM’s vagrant directory, navigate to the folder /baltrad2wradlib.
Execute the following command:
$ odc_toolbox -i data -o out -q ropo,radvol-att
Check whether a file was created in the folder /out.
BALTRAD will not create output files if these already exist. You can check that via !ls out.
!odc_toolbox --helpUsage: odc_toolbox -i <inpath> -o <outpath> -q <algorithm-list> [-p <processes>] [h]
Command-line tool for QC-processing polar data for Odyssey
Options:
-h, --help show this help message and exit
-i IPATH, --ipath=IPATH
Input path containing polar data.
-o OPATH, --opath=OPATH
Output path for writing data.
-q QC, --qc=QC Comma-separated list of which QC algorithms to run,
e.g. 'ropo,beamb'. No white spaces between these
names. For compositing, this executable hard-wires a
quality-based composite algorithm where the last QC
algorithm in the chain should be qi-total.
-d, --delete Deletes input files following their processing.
-c, --check Checks for the presence of output files. If an output
file already exists, do nothing and move on to the
next.
-p PROCS, --procs=PROCS
Number of concurrent worker processes to run. Defaults
to the maximum number of logical CPUs supported on
your hardware, but can be constrained or raised as you
wish. Use off-line for benchmarking.
-D, --write-pvols Write quality-controlled PVOLs to output path.
-a AREAID, --composite-area=AREAID
The area identifier (string) of the output composite
area to generate.
-O OFILE, --composite-file=OFILE
The file name of the output composite that will be
written to --opath. Default=composite.h5
-v, --verbose If the different steps should be displayed. I.e.
verbose information.
!odc_toolbox -i data -o out -q ropo,radvol-attException ignored in: <function _after_at_fork_child_reinit_locks at 0x7f7f2270d800>
Traceback (most recent call last):
File "/srv/conda/envs/notebook/lib/python3.11/logging/__init__.py", line 265, in _after_at_fork_child_reinit_locks
handler._at_fork_reinit()
File "/srv/conda/envs/notebook/lib/python3.11/logging/__init__.py", line 920, in _at_fork_reinit
self.lock._at_fork_reinit()
^^^^^^^^^^^^^^^^^^^^^^^^^
AttributeError: 'RLock' object has no attribute '_at_fork_reinit'
Exception ignored in: <function _after_at_fork_child_reinit_locks at 0x7f7f2270d800>
Traceback (most recent call last):
File "/srv/conda/envs/notebook/lib/python3.11/logging/__init__.py", line 265, in _after_at_fork_child_reinit_locks
handler._at_fork_reinit()
File "/srv/conda/envs/notebook/lib/python3.11/logging/__init__.py", line 920, in _at_fork_reinit
self.lock._at_fork_reinit()
^^^^^^^^^^^^^^^^^^^^^^^^^
AttributeError: 'RLock' object has no attribute '_at_fork_reinit'
!ls out201405190715_SUR.h5
Read and inspect data from Suergavere (Estonia) before and after QC with odc_toolbox
# Before QC
inp = xd.io.open_odim_datatree("data/201405190715_SUR.h5")
# After QC
out = xd.io.open_odim_datatree("out/201405190715_SUR.h5")
Georeference
inp = inp.xradar.georeference()
out = out.xradar.georeference()
swp_inp = inp["sweep_0"].ds.set_coords("sweep_mode")
swp_out = out["sweep_0"].ds.set_coords("sweep_mode")
display(swp_inp)
display(swp_out)Loading...
Design a plot we will use for all PPIs in this exercise
import cartopy.crs as ccrs
import wradlib as wrl
from cartopy.io.shapereader import Reader

map_proj = ccrs.AzimuthalEquidistant(
    central_latitude=swp_inp.latitude.values, central_longitude=swp_inp.longitude.values
)
osr_proj = wrl.georef.create_osr(
    "aeqd", lat_0=swp_inp.latitude.values, lon_0=swp_inp.longitude.values
)

geometries = list(Reader("shp/europe_countries.shp").geometries())


def plot_ppi_to_ax(ppi, ax, title="", geometries=None, **kwargs):
    pm = ppi.wrl.vis.plot(crs=map_proj, ax=ax, **kwargs)
    ax.set_title(title)
    if geometries is not None:
        ax.add_geometries(
            geometries,
            ccrs.PlateCarree(),
            facecolor="lightgrey",
            edgecolor="k",
            linewidths=1,
            zorder=-1,
        )
    wrl.vis.plot_ppi_crosshair(
        site=(ppi.longitude.values, ppi.latitude.values, ppi.altitude.values),
        ranges=[50000, 100000, 150000, 200000, ppi.range.max().values],
        angles=[0, 90, 180, 270],
        line=dict(color="white"),
        circle={"edgecolor": "white"},
        ax=ax,
        crs=osr_proj,
    )
    return pm
Plot the selected fields into one figure
fig = plt.figure(figsize=(12, 10))

ax = plt.subplot(221, projection=map_proj)
pm = plot_ppi_to_ax(
    swp_inp.DBZH.where(swp_inp.DBZH >= -10),
    ax=ax,
    geometries=geometries,
    title="Before QC",
    add_colorbar=False,
    vmin=-10,
    vmax=65,
)

ax = plt.subplot(222, projection=map_proj)
pm = plot_ppi_to_ax(
    swp_out.DBZH.where(swp_out.DBZH >= -10),
    ax=ax,
    geometries=geometries,
    title="After QC",
    add_colorbar=False,
    vmin=-10,
    vmax=65,
)

ax = plt.subplot(223, projection=map_proj)
qm = plot_ppi_to_ax(
    swp_out.quality1,
    ax=ax,
    geometries=geometries,
    add_colorbar=False,
    title="Quality 1",
)

ax = plt.subplot(224, projection=map_proj)
qm = plot_ppi_to_ax(
    swp_out.QIND, ax=ax, geometries=geometries, add_colorbar=False, title="Quality 2"
)

plt.tight_layout()

# Add colorbars
fig.subplots_adjust(right=0.9)
cax = fig.add_axes((0.9, 0.6, 0.03, 0.3))
cbar = plt.colorbar(pm, cax=cax)
cbar.set_label("Horizontal reflectivity (dBZ)", fontsize="large")

cax = fig.add_axes((0.9, 0.1, 0.03, 0.3))
cbar = plt.colorbar(qm, cax=cax)
cbar.set_label("Quality index", fontsize="large")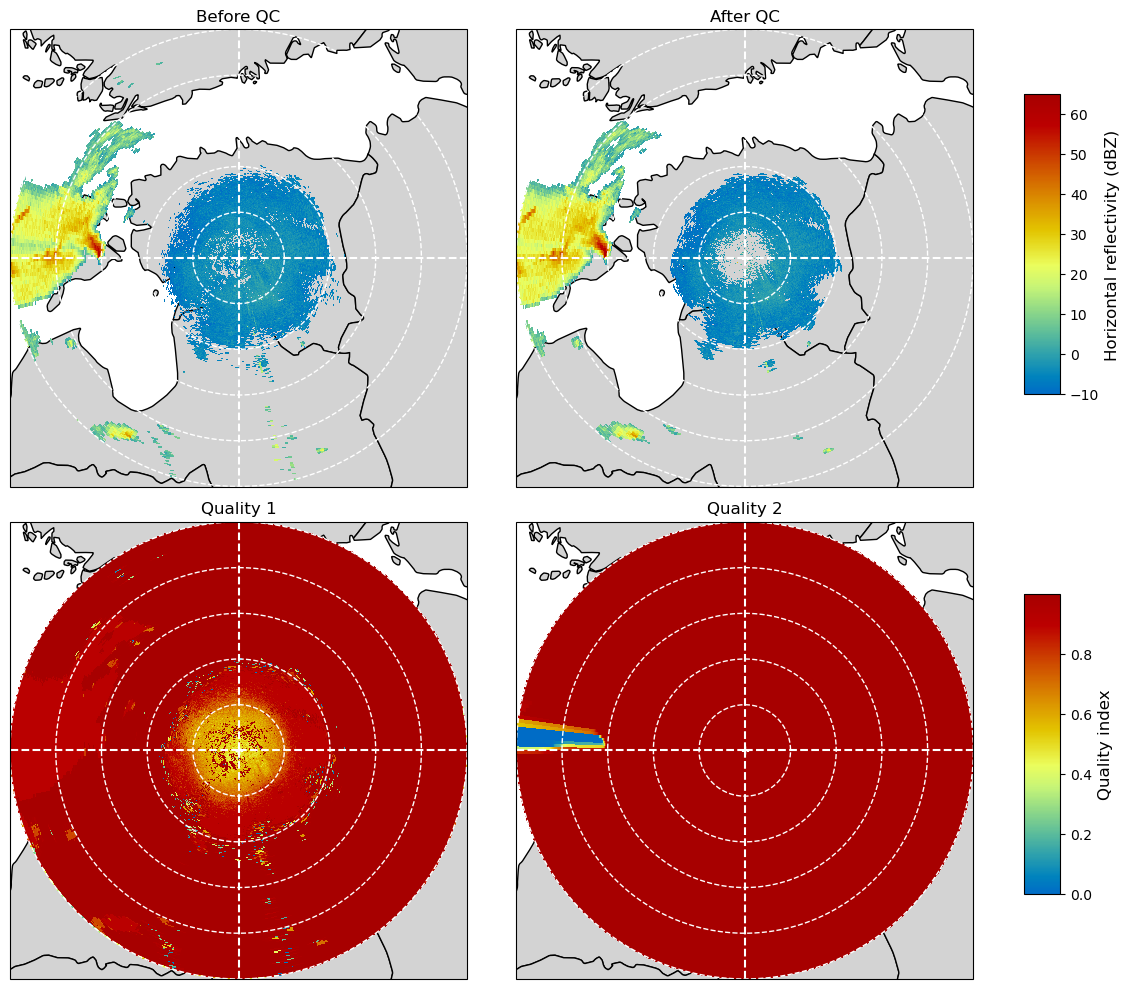
Collect and plot the polarimetric moments from the original ODIM_H5 dataset
fig = plt.figure(figsize=(12, 12))

ax = plt.subplot(221, projection=map_proj)
pm = plot_ppi_to_ax(swp_inp.RHOHV, ax=ax, title="RhoHV", geometries=geometries)

ax = plt.subplot(222, projection=map_proj)
pm = plot_ppi_to_ax(swp_inp.PHIDP, ax=ax, title="PhiDP", geometries=geometries)

ax = plt.subplot(223, projection=map_proj)
pm = plot_ppi_to_ax(
    swp_inp.ZDR, ax=ax, title="Differential reflectivity", geometries=geometries
)

ax = plt.subplot(224, projection=map_proj)
pm = plot_ppi_to_ax(
    swp_inp.VRAD, ax=ax, title="Doppler velocity", geometries=geometries
)

plt.tight_layout()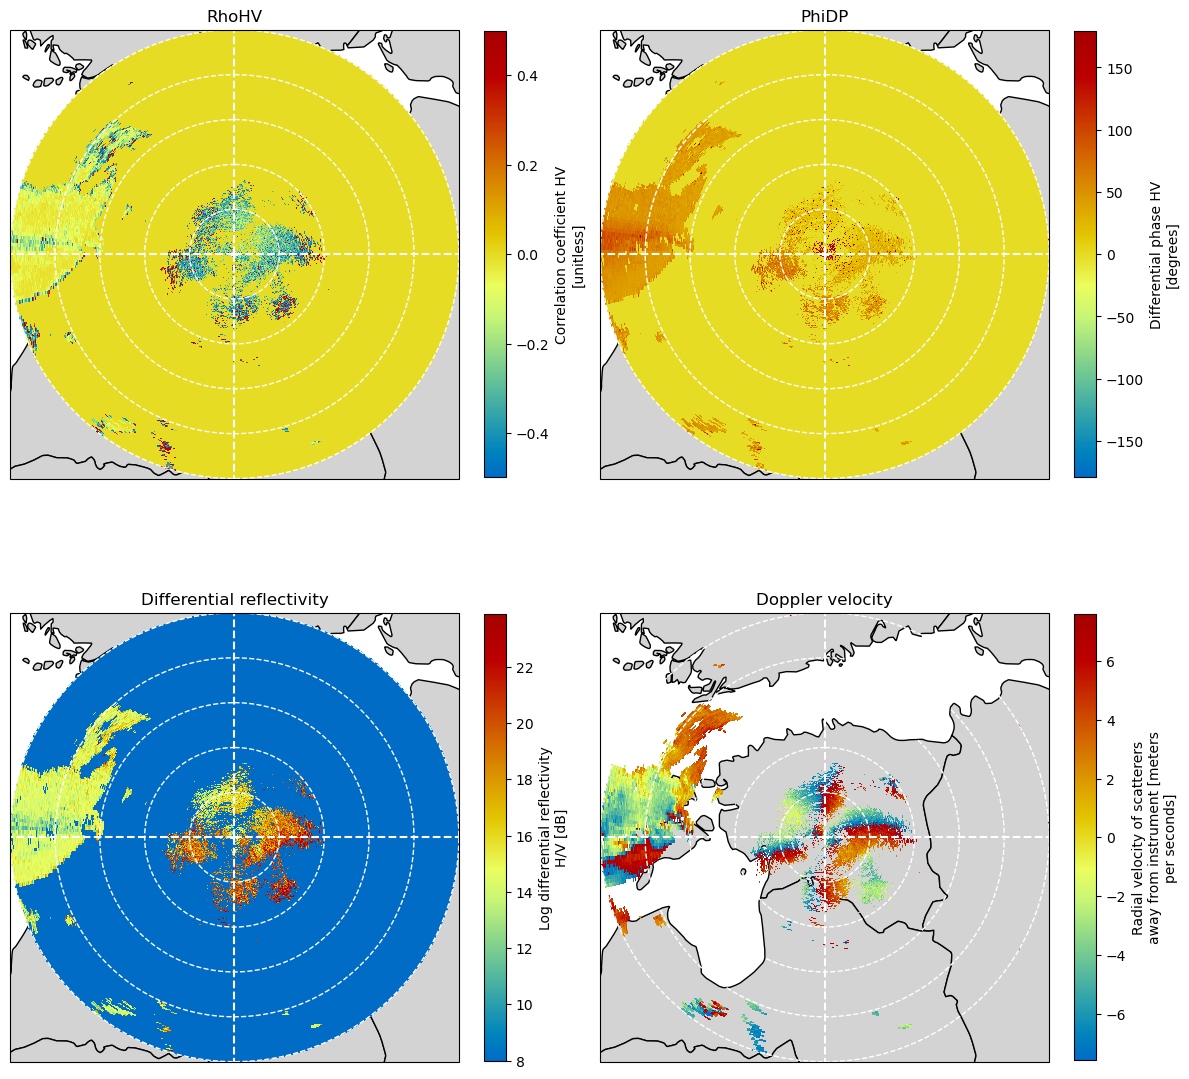
Try some filtering and attenuation correction
# Set ZH to a very low value where we do not expect valid data
zh = swp_inp.DBZH.fillna(-32.0)
# Retrieve PIA by using some constraints (see https://docs.wradlib.org/en/latest/notebooks/attenuation/attenuation.html for help)
pia = zh.wrl.atten.correct_attenuation_constrained(
    constraints=[wradlib.atten.constraint_dbz, wradlib.atten.constraint_pia],
    constraint_args=[[64.0], [20.0]],
)

# Correct reflectivity by PIA
zh_corrected = swp_inp.DBZH + pia
/srv/conda/envs/notebook/lib/python3.11/site-packages/wradlib/trafo.py:339: RuntimeWarning: overflow encountered in power
return 10.0 ** (x / 10.0)
Compare results against QC from odc_toolbox
fig = plt.figure(figsize=(18, 10))

ax = plt.subplot(131, projection=map_proj)
pm = plot_ppi_to_ax(
    swp_inp.DBZH.where(swp_out.DBZH >= -10),
    ax=ax,
    geometries=geometries,
    title="Before QC",
)

ax = plt.subplot(132, projection=map_proj)
pm = plot_ppi_to_ax(
    swp_out.DBZH.where(swp_out.DBZH >= -10),
    ax=ax,
    geometries=geometries,
    title="After QC using BALTRAD Toolbox",
)

ax = plt.subplot(133, projection=map_proj)
pm = plot_ppi_to_ax(
    zh_corrected.where(zh_corrected >= -10),
    ax=ax,
    geometries=geometries,
    title="After QC using wradlib",
)