making sense out of data and metadata
retrieve data from s3 bucket
import os
import urllib.request
from pathlib import Path

# Set the URL for the cloud
URL = "https://js2.jetstream-cloud.org:8001/"
!mkdir -p data
files = [
    "pythia/radar/erad2024/baltrad/baltrad_short_course/201405190715_SUR.h5",
]
for file in files:
    name = os.path.join("data", Path(file).name)
    if not os.path.exists(name):
        print(f"downloading, {name}")
        urllib.request.urlretrieve(f"{URL}{file}", name)
downloading, data/201405190715_SUR.h5
Import the file I/O module along with the main RAVE module containing useful constants
%matplotlib inline
import _raveio, _rave
Read an input ODIM_H5 file
rio = _raveio.open("data/201405190715_SUR.h5")What is the payload in the I/O container?
rio.objectType is _rave.Rave_ObjectType_PVOLTrueHow many scans does this volume contain?
pvol = rio.object
print("%i scans in polar volume" % pvol.getNumberOfScans())
8 scans in polar volume
Ascending or descending scan strategy?
pvol.isAscendingScans()TrueWhere is this site?
Note that all angles are represented internally in radians
from Proj import rd

print(
    "Site is located at %2.3f° lon, %2.3f° lat and %3.1f masl"
    % (pvol.longitude * rd, pvol.latitude * rd, pvol.height)
)
print("Site's ODIM source identifiers are: %s" % pvol.source)
Site is located at 25.519° lon, 58.482° lat and 157.0 masl
Site's ODIM source identifiers are: WMO:26232,RAD:EE41,PLC:Sürgavere,NOD:eesur
Access lowest scan and query some characteristics
scan = pvol.getScan(0)
nrays, nbins = scan.nrays, scan.nbins
print("Elevation angle %2.1f°" % (scan.elangle * rd))
print("%i rays per sweep" % nrays)
print("%i bins per ray" % nbins)
print("%3.1f meter range bins" % scan.rscale)
print("First ray scanned is ray %i (indexing starts at 0)" % scan.a1gate)
print("Data acquisition started on %s:%sZ" % (scan.startdate, scan.starttime))
print("Data acquisition ended on %s:%sZ" % (scan.enddate, scan.endtime))
print(
    "Scan contains %i quantities: %s"
    % (len(scan.getParameterNames()), scan.getParameterNames())
)
Elevation angle 0.5°
360 rays per sweep
831 bins per ray
300.0 meter range bins
First ray scanned is ray 189 (indexing starts at 0)
Data acquisition started on 20140519:071509Z
Data acquisition ended on 20140519:071537Z
Scan contains 10 quantities: ['DBZH', 'RHOHV', 'HCLASS', 'WRADH', 'PHIDP', 'ZDR', 'SQIH', 'KDP', 'VRADH', 'TH']
Access horizontal reflectivity and query some characteristics
dbzh = scan.getParameter("DBZH")
print("Quantity is %s" % dbzh.quantity)
print("8-bit unsigned byte data? %s" % str(dbzh.datatype is _rave.RaveDataType_UCHAR))
print(
    "Linear scaling coefficients from 0-255 to dBZ: gain=%2.1f, offset=%2.1f"
    % (dbzh.gain, dbzh.offset)
)
print(
    "Unradiated areas = %2.1f, radiated areas with no echo = %2.1f"
    % (dbzh.nodata, dbzh.undetect)
)

dbzh_data = dbzh.getData()  # Accesses the NumPy array containing the reflectivities
print(
    "NumPy array's dimensions = %s and type = %s"
    % (str(dbzh_data.shape), dbzh_data.dtype)
)
Quantity is DBZH
8-bit unsigned byte data? True
Linear scaling coefficients from 0-255 to dBZ: gain=0.5, offset=-32.0
Unradiated areas = 255.0, radiated areas with no echo = 0.0
NumPy array's dimensions = (360, 831) and type = uint8
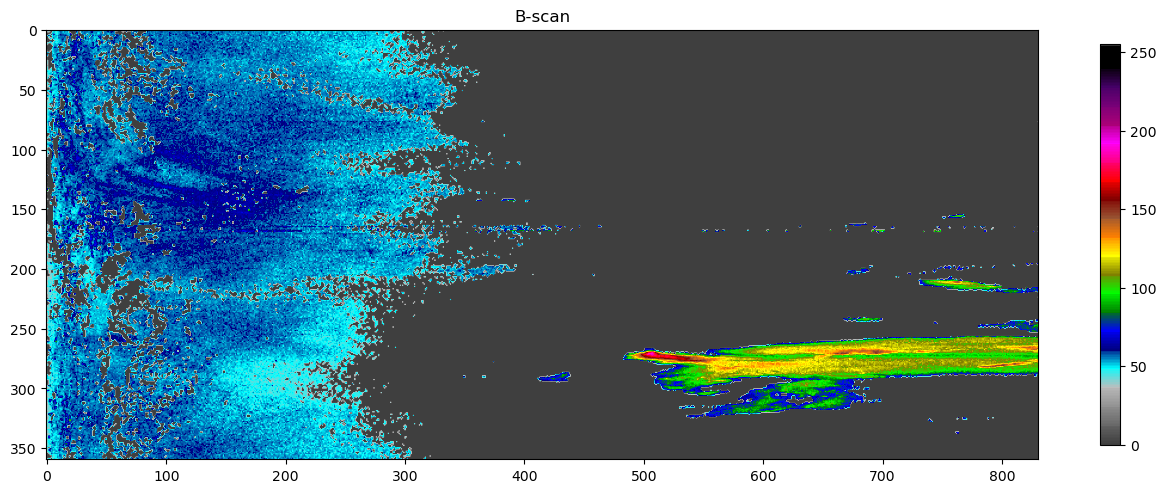
A primitive visualizer for plotting B-scans
# Convenience functionality. First convert a palette from GoogleMapsPlugin for use with matplotlib
import matplotlib
from GmapColorMap import dbzh as pal

colorlist = []
for i in range(0, len(pal), 3):
    colorlist.append([pal[i] / 255.0, pal[i + 1] / 255.0, pal[i + 2] / 255.0])

# Then create a simple plotter
import matplotlib.pyplot as plt


def plot(data):
    fig = plt.figure(figsize=(16, 12))
    plt.title("B-scan")
    plt.imshow(data, cmap=matplotlib.colors.ListedColormap(colorlist), clim=(0, 255))
    plt.colorbar(shrink=float(nrays) / nbins)
plot(dbzh_data)
Management of optional metadata
While manadatory metadata are represented as object attributes in Python, optional metadata are not!
print("Polar volume has %i optional attributes" % len(pvol.getAttributeNames()))
print("Polar scan has %i optional attributes" % len(scan.getAttributeNames()))
print(
    "Quantity %s has %i optional attributes"
    % (dbzh.quantity, len(dbzh.getAttributeNames()))
)

print("Mandatory attribute: beamwidth is %2.1f°" % (pvol.beamwidth * rd))
print(
    "Optional attributes: Radar is a %s running %s"
    % (pvol.getAttribute("how/system"), pvol.getAttribute("how/software"))
)
Polar volume has 14 optional attributes
Polar scan has 36 optional attributes
Quantity DBZH has 3 optional attributes
Mandatory attribute: beamwidth is 1.0°
Optional attributes: Radar is a VAISWRM200 running IRIS
Add a bogus attribute
dbzh.addAttribute("how/foo", "bar")
print(
    "Quantity %s now has %i optional attributes"
    % (dbzh.quantity, len(dbzh.getAttributeNames()))
)
Quantity DBZH now has 4 optional attributes
Create an empty parameter and populate it
import _polarscanparam

param = _polarscanparam.new()
param.quantity = "DBZH"
param.nodata, param.undetect = 255.0, 0.0
param.gain, param.offset = 0.4, -30.0

import numpy

data = numpy.zeros((420, 500), numpy.uint8)
param.setData(data)
Create an empty scan and add the parameter to it
import _polarscan
from Proj import dr

newscan = _polarscan.new()
newscan.elangle = 25.0 * dr
newscan.addAttribute("how/simulated", "True")

newscan.addParameter(param)
print("%i rays per sweep" % newscan.nrays)
print("%i bins per ray" % newscan.nbins)
420 rays per sweep
500 bins per ray
See how the parameter’s dimensions were passed along to the scan, so they don’t have to be set explicitly. Nevertheless, plenty of metadata must be handled explicitly or ODIM_H5 files risk being incomplete.
newscan.a1gate = 0
newscan.beamwidth = 1.0 * dr
newscan.rscale = 500.0
newscan.rstart = (
    0.0  # Distance in meters to the start of the first range bin, unknown=0.0
)
newscan.startdate = "20140831"
newscan.starttime = "145005"
newscan.enddate = "20140831"
newscan.endtime = "145020"

# Top-level attributes
newscan.date = "20140831"
newscan.time = "145000"
newscan.source = "WMO:26232,RAD:EE41,PLC:Sürgavere,NOD:eesur"
newscan.longitude = 25.519 * dr
newscan.latitude = 58.482 * dr
newscan.height = 157.0
Now create a new I/O container and write the scan to ODIM_H5 file.
container = _raveio.new()
container.object = newscan
container.save("data/myscan.h5")

import os

print("ODIM_H5 file is %i bytes large" % os.path.getsize("data/myscan.h5"))
ODIM_H5 file is 4721 bytes large
Remove compression. It makes file I/O faster. You can also tune HDF5 file-creation properties through the I/O container object.
container.compression_level = 0  # ZLIB compression levels 0-9
container.save("data/myscan.h5")
print("ODIM_H5 file is now %i bytes large" % os.path.getsize("data/myscan.h5"))
ODIM_H5 file is now 214320 bytes large