
Xradar Basics
Overview
Xradar general overview
Radar data IO
Radar data georeferencing
Data visualization
Prerequisites
| Concepts | Importance | Notes |
|---|---|---|
| Intro to Xarray | Necessary | Basic features |
| Radar Cookbook | Necessary | Radar basics |
| Matplotlib | Necessary | Plotting basic features |
Time to learn: 30 minutes
Imports
import xradar as xd
import pyart
import wradlib as wrl

import fsspec
import numpy as np
import xarray as xr

import matplotlib.pyplot as plt
import cartopy.crs as ccrs
## You are using the Python ARM Radar Toolkit (Py-ART), an open source
## library for working with weather radar data. Py-ART is partly supported
## by the U.S. Department of Energy Office of Science as part of
## the Atmospheric Radiation Measurement (ARM) User Facility.
##
## If you use this software to prepare a publication, please cite:
##
##     JJ Helmus and SM Collis, JORS 2016, doi: 10.5334/jors.119
Xradar
Xradar is a Python package developed to streamline the reading and writing of radar data across various formats, with exports aligned to standards like ODIM_H5 and CfRadial. Born from the Open Radar Science Community’s collaboration at ERAD2022, Xradar uses an xarray-based data model, compatible with the upcoming CfRadial2.1/FM301 standard. This ensures seamless integration with other xarray-based software and existing open-source radar processing tools.
Xradar data model
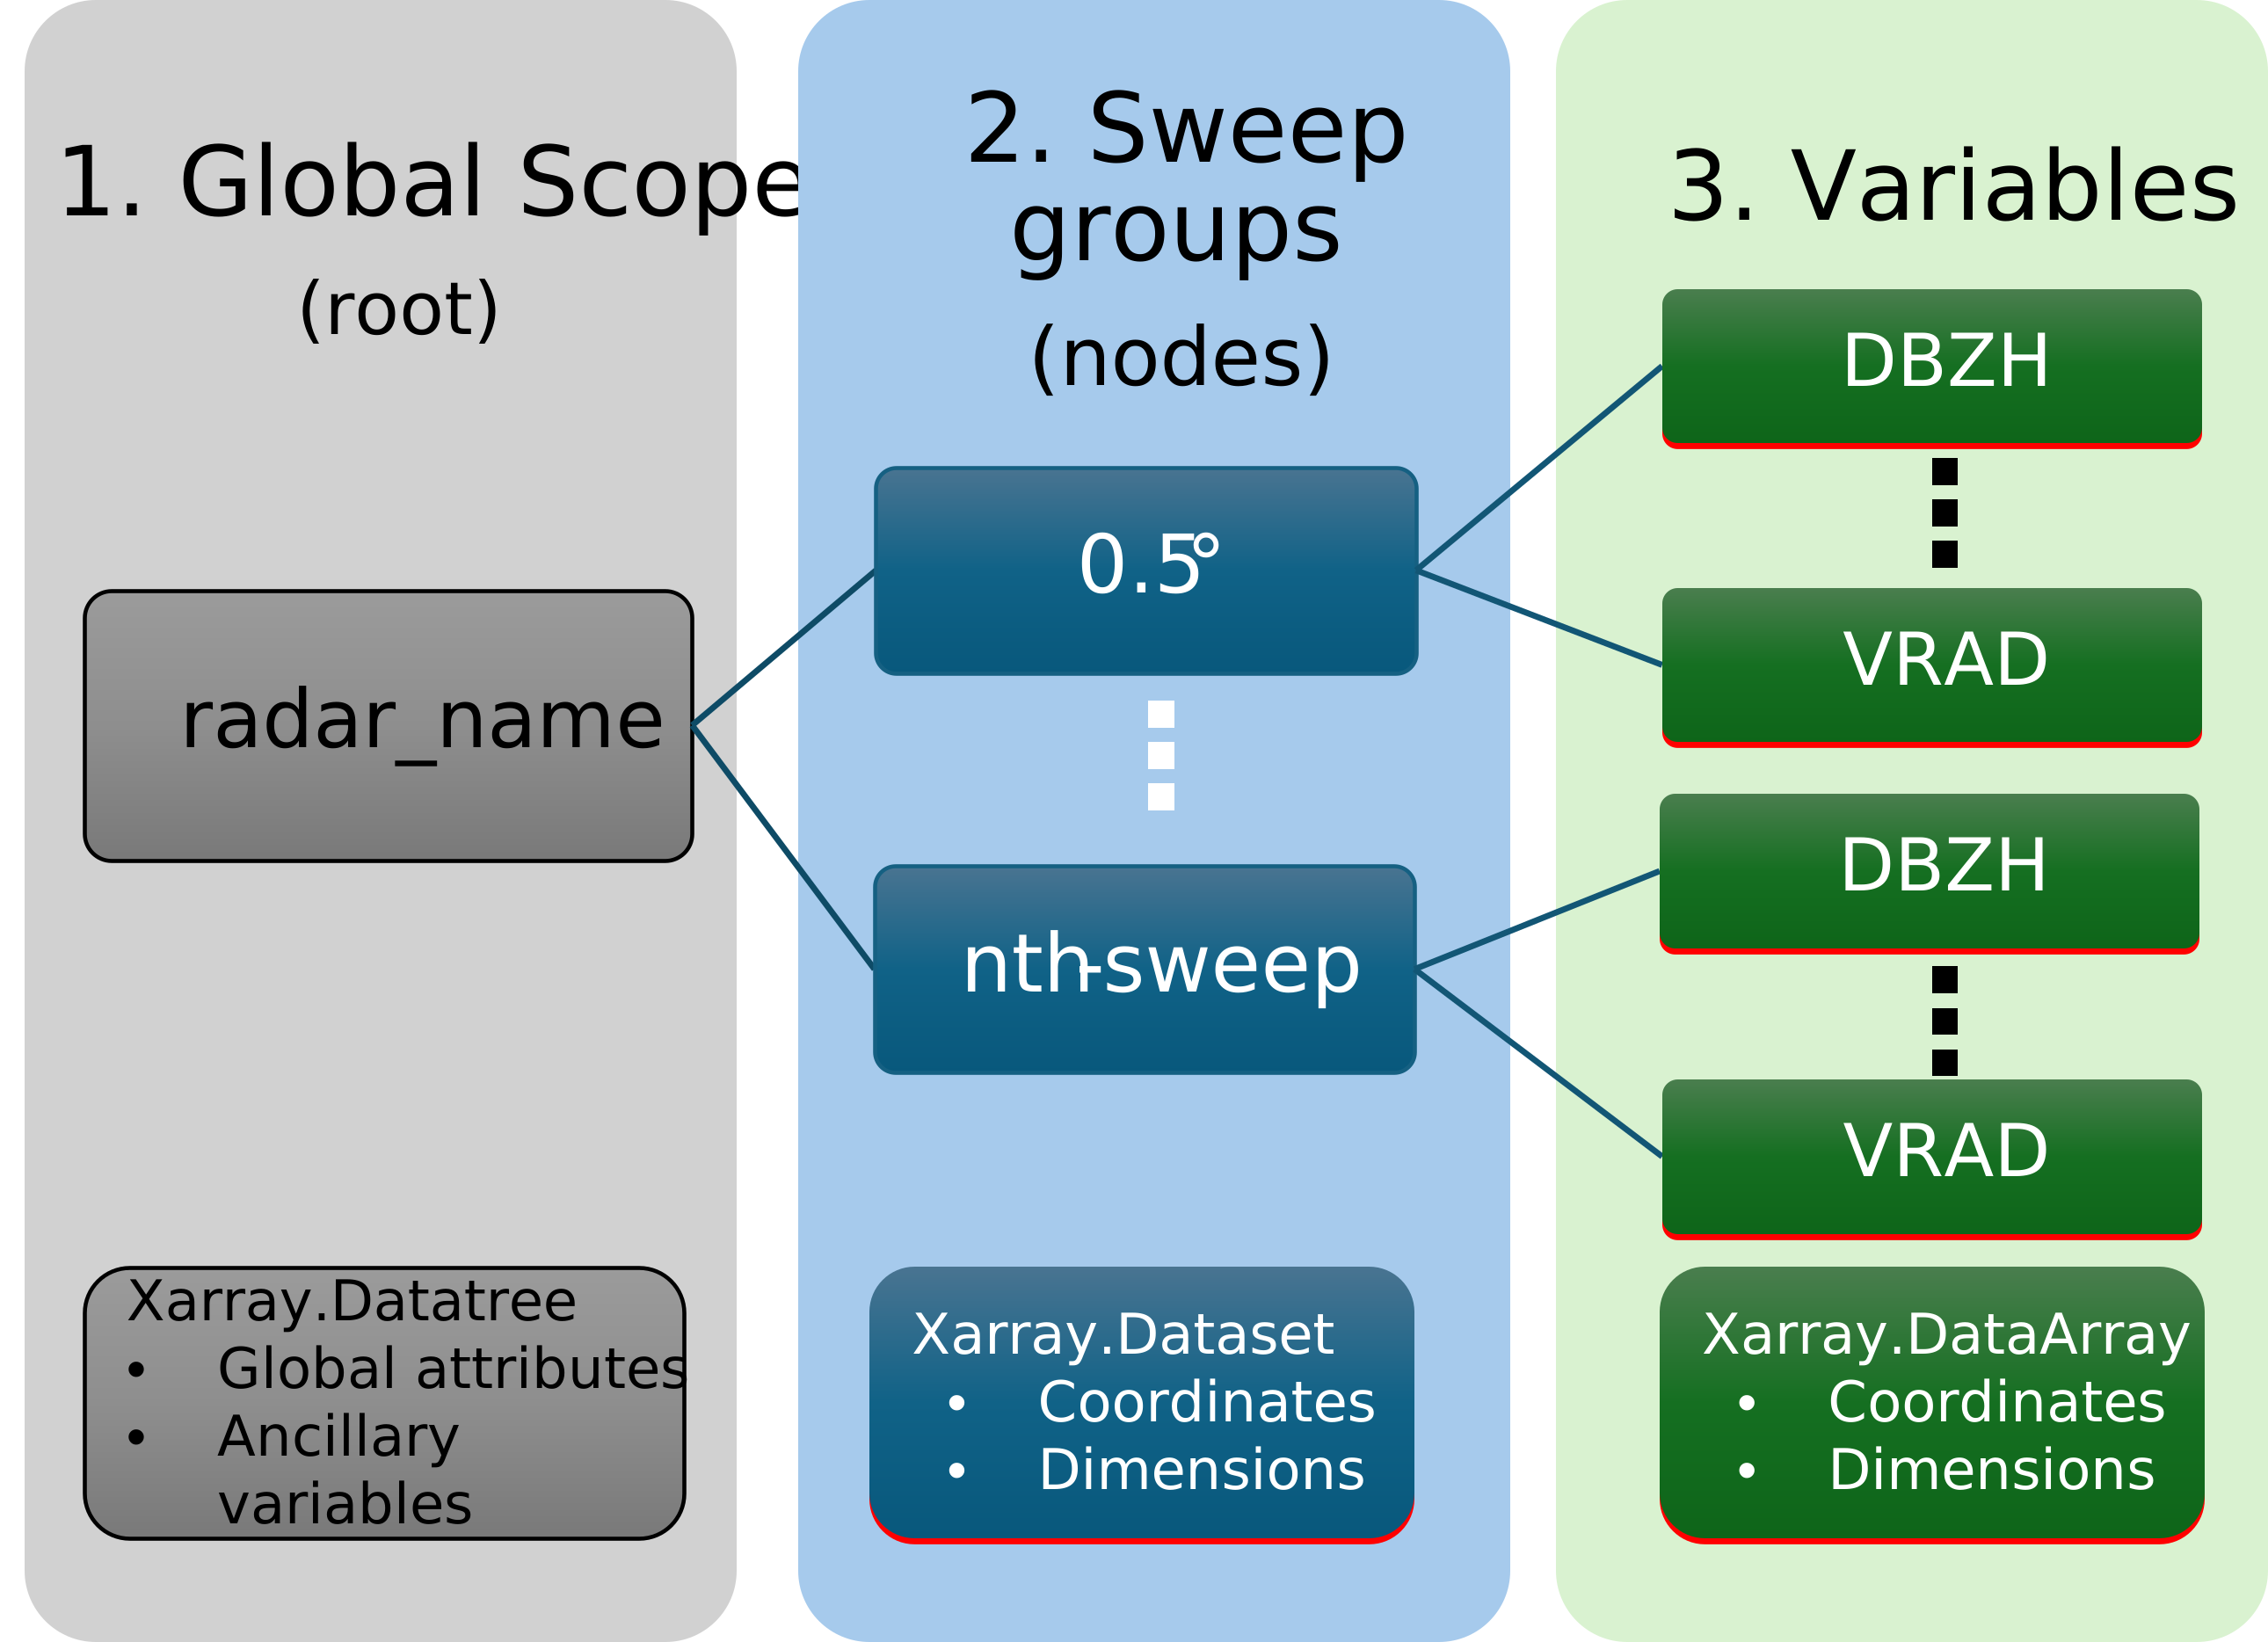
Xradar leverages the upcoming FM301 standard, a subset of CfRadial2.0, using Xarray to efficiently manage radar data.
DataTree Structure (CfRadial2.1/FM301 standard)
Xradar employs xarray.DataTree objects to organize radar sweeps within a single structure, where each sweep is an xarray.Dataset containing relevant metadata and variables.
Xradar importers
Xradar supports several importers to handle different radar data formats. These importers typically include:
ODIM_H5: For reading radar data in the ODIM_H5 format, which is widely used in Europe and supported by the EUMETNET OPERA program.
CfRadial: For importing data in the CfRadial format, which is commonly used in the atmospheric sciences community.
SIGMET/IRIS: For ingesting radar data from SIGMET/IRIS formats, which are used by various weather radar systems globally.
GAMIC: For reading data from GAMIC radars, which use their proprietary format.
For more importers check here
Let’s find some Serrbian radar data.
OSN_ENDPOINT = "https://umn1.osn.mghpcc.org"
BUCKET = "nexrad-arco"
fs = fsspec.filesystem(
"s3", anon=True, client_kwargs={"endpoint_url": OSN_ENDPOINT},
)
for site, prefix in [("FGora", "fgora_vol"), ("Jastrebac", "jastrebac_vol")]:
files = sorted(fs.glob(f"{BUCKET}/{prefix}/**/*.vol"))
print(f"{site} raw files: {len(files)}")
for f in files[:4]:
print(f" {f.split('/')[-1]}")
print()FGora raw files: 324
2014051500012000V.vol
2014051500012000W.vol
2014051500012000dBZ.vol
2014051500012000dBuZ.vol
Jastrebac raw files: 864
2014051500010400KDP.vol
2014051500010400PhiDP.vol
2014051500010400RhoHV.vol
2014051500010400V.vol
fgora_raw = sorted(fs.glob(f"{BUCKET}/fgora_vol/**/*.vol"))
sample_file = fgora_raw[2]  # a dBZ file
print(f"File: {sample_file.split('/')[-1]}")

local_path = fsspec.open_local(
    f"simplecache::s3://{sample_file}",
    s3={"anon": True, "client_kwargs": {"endpoint_url": OSN_ENDPOINT}},
)
dtree = xd.io.open_rainbow_datatree(local_path)
dtree
File: 2014051500012000dBZ.vol
In this Xarray.Datatree object, the first two nodes contains radar metadata and the others contains Xarray.Datasets for each sweeps.
for sweep in dtree.children:
    try:
        print(f"{sweep} - elevation {np.round(dtree[sweep]['sweep_fixed_angle'].values[...], 1)}")
    except KeyError:
        print (sweep)
sweep_0 - elevation 0.5
sweep_1 - elevation 1.3
sweep_2 - elevation 2.3
sweep_3 - elevation 3.5
sweep_4 - elevation 4.9
sweep_5 - elevation 6.6
sweep_6 - elevation 8.5
sweep_7 - elevation 10.8
sweep_8 - elevation 13.5
sweep_9 - elevation 16.7
sweep_10 - elevation 20.5
sweep_11 - elevation 25.0
Let’s explore the 0.5 degrees elevation (‘sweep_0’)
ds_sw0 = dtree["sweep_0"].ds.assign_coords(dtree["/"].coords)
display(ds_sw0)Xradar visualization
We can make a plot using xarray.plot functionality.
ds_sw0.DBZH.plot(
    cmap="ChaseSpectral",
    vmax=60,
    vmin=-10,
)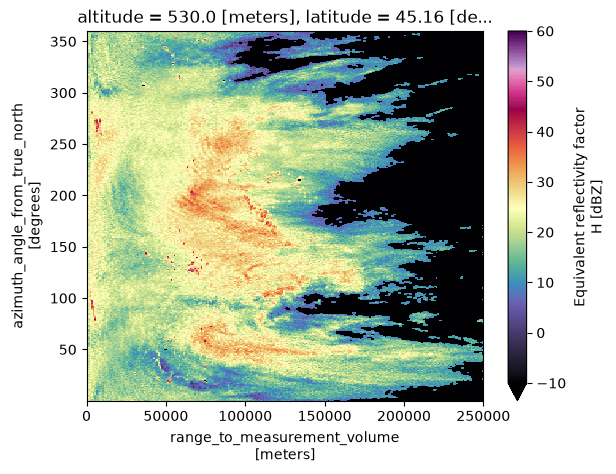
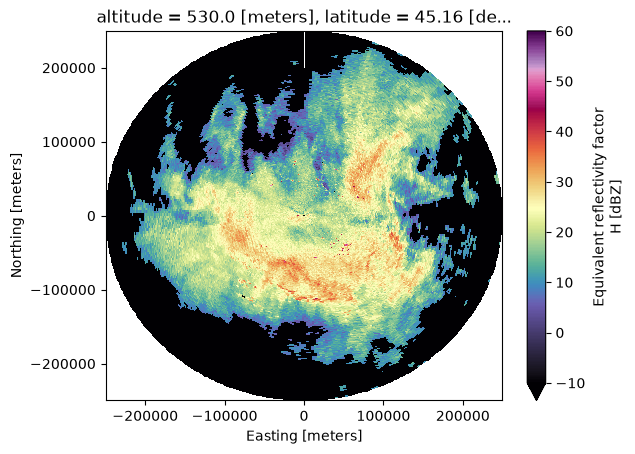
The radar data in the Xarray.Dataset object includes range and azimuth as coordinates. To create a radial plot, apply the xradar.georeference method. This method will generate x, y, and z coordinates for the plot.
ds_sw0 = ds_sw0.xradar.georeference()
display(ds_sw0)We can now create a radial plot passing x and y coordinates
ds_sw0.DBZH.plot(
    x="x",
    y= "y",
    cmap="ChaseSpectral",
    vmax=60,
    vmin=-10,
)
Data slicing
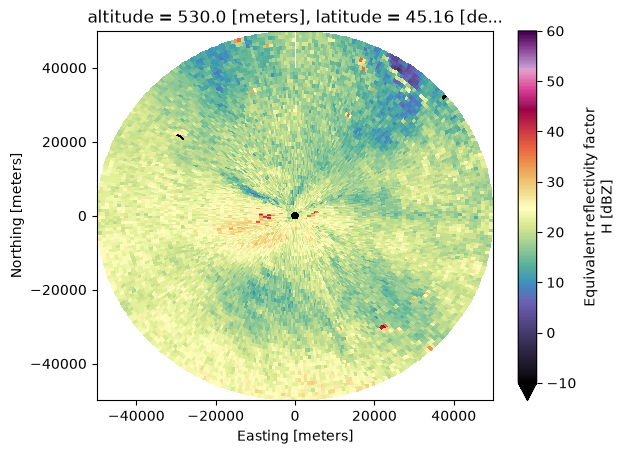
We can use the power of Xarray to acces data within the first 50 kilometers by slicing along coordinates.
ds_sw0.sel(range=slice(0, 5e4)).DBZH.plot(
    x="x",
    y= "y",
    cmap="ChaseSpectral",
    vmax=60,
    vmin=-10,
)
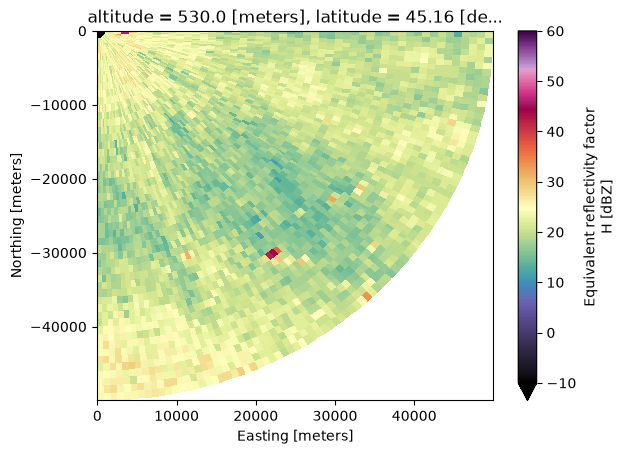
Let’s suppose we want to subset between 90 and 180 degrees angle in azimuth.
ds_sw0.sel(azimuth=slice(90, 180), range=slice(0, 5e4)).DBZH.plot(
    x="x",
    y= "y",
    cmap="ChaseSpectral",
    vmax=60,
    vmin=-10,
)
Perhaps, we just want to see radar reflectivity along the 100 degrees angle in azimuth.
ds_sw0 = ds_sw0.pipe(xd.util.remove_duplicate_rays)ds_sw0.sel(azimuth=143, method="nearest").DBZH.plot()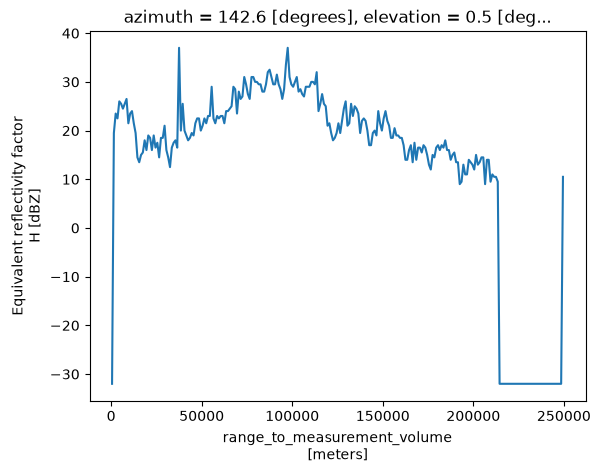
Xradar integration
Py-Art
Xradar datatree objects can be ported to Py-ART radar objects using the pyart.xradar.Xradar method.
radar = pyart.xradar.Xradar(dtree)
fig = plt.figure(figsize=[10, 8])
pyart_display = pyart.graph.RadarMapDisplay(radar)
pyart_display.plot_ppi_map('DBZH', sweep=0)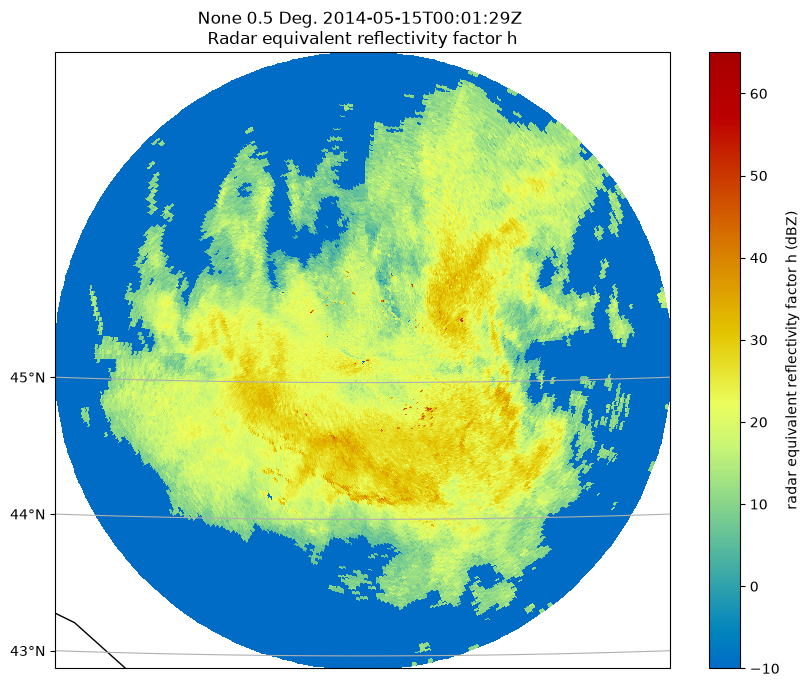
del pyart_displayWradlib
Wradlib functionality can also be applied to Xarray.Datatree objects. For example, the wradlib.georef module can be used to enrich data by adding geographical coordinates.
for key in list(dtree.children):
    if "sweep" in key:
        dtree[key].ds = dtree[key].ds.assign_coords(dtree["/"].coords).wrl.georef.georeference(
            crs=wrl.georef.get_default_projection()
).drop_vars(["altitude", "latitude", "longitude"])dtree["sweep_0"].dsswp = dtree["sweep_0"].ds.set_coords("sweep_mode")
swp.DBZH.wrl.vis.plot(vmax=60, vmin=-10)
plt.gca().set_title(f"Fruška Gora - {swp.time.min().values.astype("<M8[s]")} - {swp.sweep_fixed_angle.values:.1f} deg");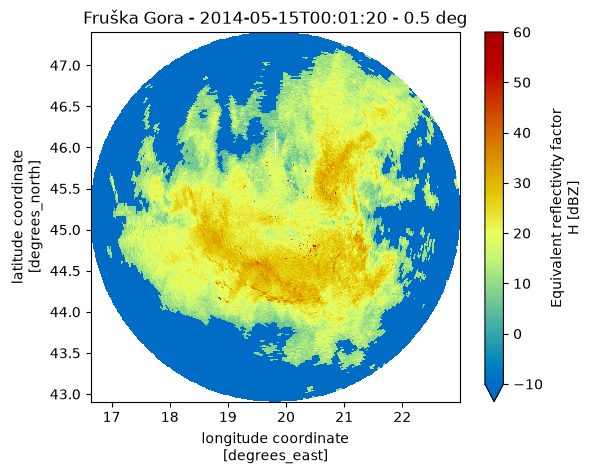
Xradar exporters
In xradar, exporters convert radar data into various formats for analysis or integration. Exporting is supported for recognized standards, including:
CfRadial1
CfRadial2
ODIM
Zarr
Although Zarr is not a traditional standard format, it provides an analysis-ready, cloud-optimized format that enhances data accessibility and performance.
dtree.to_zarr("tree.zarr", consolidated=True, mode="w")<xarray.backends.zarr.ZarrStore at 0x7fa84df502c0>dt_back = xr.open_datatree("tree.zarr", engine="zarr",chunks={})display(dt_back)Summary
Xradar is a Python library designed for working with radar data. It extends xarray to include radar-specific functionality, such as purpose-based accessors and georeferencing methods. It supports exporting data in various formats, including CfRadial1, CfRadial2, ODIM, and Zarr. xradar facilitates the analysis, visualization, and integration of radar data with other tools and systems.