



Composite To Grid
In this notebook we show the production of a maximum reflectivity composite from Fruška_Gora Radar and Jastrebac Radar to a common cartesian grid.
Claim Data
We use the preprocess data from Gridding Polar Data.
# prefix = "Fgora"  # single-pol, 12 sweeps × 360 az × 250 range, 2014 + 2017 + 2026
# prefix = "jastrebac_250m"  # dual-pol, 12 × 360 × 1000, 2014 only
prefix = "jastrebac_500m" # dual-pol, 12 × 360 × 500, 2017 + 2026Get Lowest Sweep
sweep = "sweep_0"Get Case
case = "2017"
ipol = "nearest"jastrebac = f"{prefix}_{sweep}_grid_{ipol}.nc"
fgora = f"Fgora_{sweep}_grid_{ipol}.nc"
filenames = {"jastrebac": jastrebac, "fgora": fgora}
ctree = xr.DataTree()
for radar, filename in filenames.items():
ds = xr.open_dataset(filename, chunks={}).sel(vcp_time=case)
ds = ds.assign_coords(vcp_time=ds.vcp_time.dt.floor("5min")).sortby("vcp_time")
ctree[radar] = ds
display(ctree)Loading...
Plot Overview
fig, axs = plt.subplots(1, 2, figsize=(12, 5), sharey=True)
ax = axs.flat[1]
ctree["jastrebac"].ds.DBZH[0].wrl.vis.plot(ax=ax, vmin=0, vmax=60)
ax.set_title("Radar Jastrebac")
ax.set_xlim(min(ctree["fgora"].ds.x.min(), ctree["jastrebac"].ds.x.min()), max(ctree["fgora"].ds.x.max(), ctree["jastrebac"].ds.x.max()))
ax.set_ylim(min(ctree["fgora"].ds.y.min(), ctree["jastrebac"].ds.y.min()), max(ctree["fgora"].ds.y.max(), ctree["jastrebac"].ds.y.max()))
ax = axs.flat[0]
ctree["fgora"].ds.DBZH[0].wrl.vis.plot(ax=ax, vmin=0, vmax=60)
ax.set_title("Radar Fruŝka Gora")
ax.set_xlim(min(ctree["fgora"].ds.x.min(), ctree["jastrebac"].ds.x.min()), max(ctree["fgora"].ds.x.max(), ctree["jastrebac"].ds.x.max()))
ax.set_ylim(min(ctree["fgora"].ds.y.min(), ctree["jastrebac"].ds.y.min()), max(ctree["fgora"].ds.y.max(), ctree["jastrebac"].ds.y.max()))
(-3790641.300687875, -3116641.300687875)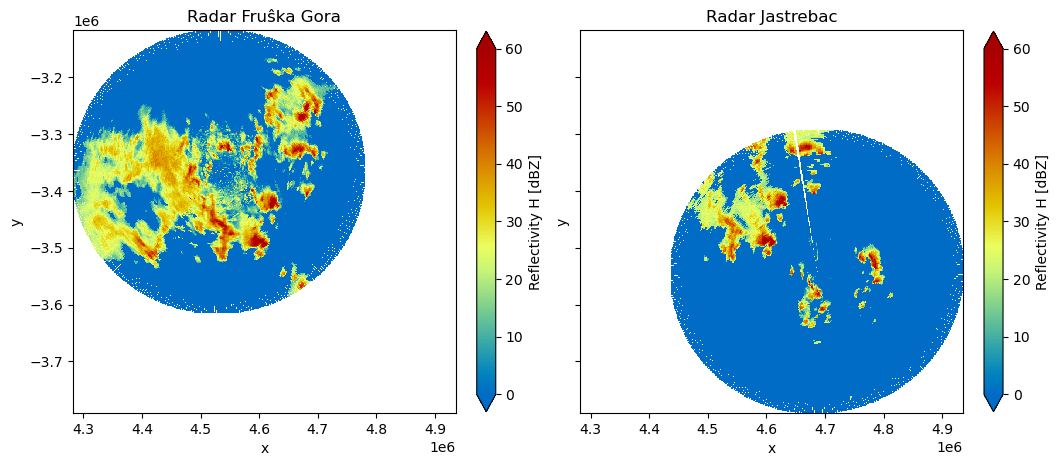
Compositing
Before compositing we combine the two radar grids into one Dataset.
radars = xr.DataArray(ctree.children, dims="radar")
radargrids = xr.concat([ctree[radar].ds.DBZH for radar in ctree.children], dim=radars)

display(radargrids)
Loading...
Then we finally reduce over the radar dimension to create the final output.
composite = radargrids.max("radar")
display(composite)
Loading...
Plot Result
Always check your source data! In our case the first timestep is only available for Fruška_Gora Radar, Jastrebac Radar is missing.
csel = composite.isel(vcp_time=0)
csel.where(csel>0.1).plot(cmap="HomeyerRainbow", vmin=0, vmax=60)
plt.gca().set_title(f"{csel.vcp_time.values.astype('M8[s]')} - Radar Fruŝka Gora only")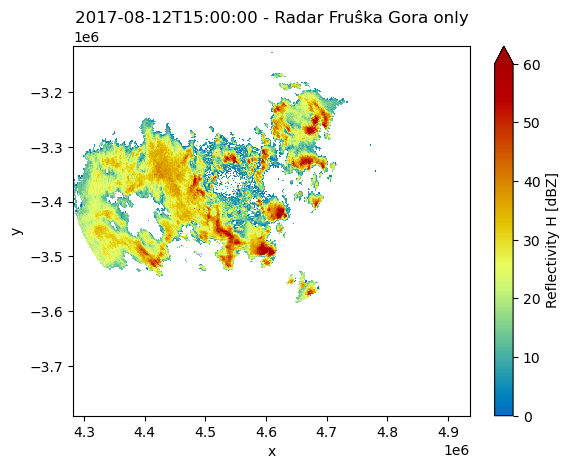
In the second timestep, Jastrebac is contained in the composite.
csel = composite.isel(vcp_time=1)
csel.where(csel>0.1).plot(cmap="HomeyerRainbow", vmin=0, vmax=60)
plt.gca().set_title(f"{csel.vcp_time.values.astype('M8[s]')} - Composite")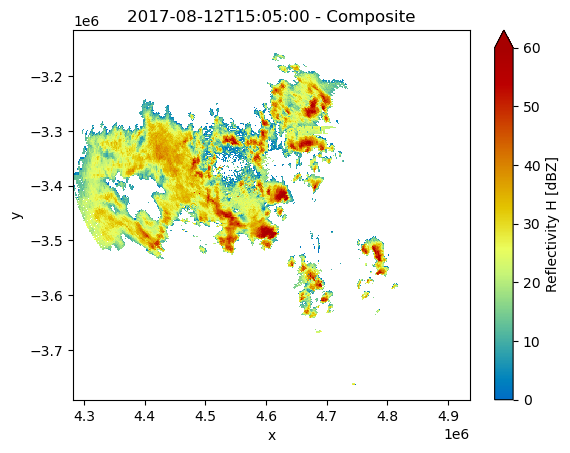
Write Composite
outname_composit = f"{prefix}_{sweep}_{case}_comp_{ipol}.nc"
composite.to_netcdf(outname_composit)
grd = xr.open_dataset(outname_composit)
display(grd)Loading...
Next Steps
You’ve completed the compositing workflow for the selected dataset. Return to case selection step, change accordingly, and rerun the notebook.